NEWS
Is Mouse Input Random Enough for Generating Secret Keys?
- Introduction
- Previous Work
- Method
- Results
- Discussion
- Future Work
- Conclusion (← summary)
1. Introduction
Cryptographic randomness is used to generate strong encryption and signing keys, such as for PGP, SSH, and disk encryption. Obtaining or successfully guessing the random values allows an attacker to gain access to encrypted data or forge digital signatures.
Using mouse movement events as inputs for randomness is most common among long-lived keys1, such as for SSH and disk encryption. Both the cursor position and the time at which the mouse moved are used for deriving cryptographic key data.
Adding mouse inputs to other randomness sources is beneficial2. However, there does not appear to be research on how random mouse inputs actually are. Are they consistently unpredictable enough to rely on and even use as the only source of randomness? How many inputs are required to create a safe key?
2. Previous Work
As previously summarized on the Information Security Stack Exchange site under the question “What research suggests that user’s mouse movements are (not) sufficiently unpredictable for secret key generation?”, one of the only sources of information that goes around is the PuTTY source code, where the author describes the conclusions of statistical tests done some time before November 2000. Unfortunately, the method is not described. All relevant previous work that could be found thus amounts to:
* My brief statistical tests on mouse movements
* suggest that there are about 2.5 bits of
* randomness in the x position, 2.5 in the y
* position, and 1.7 in the message time, making
* 5.7 bits of unpredictability per mouse movement.
* However, other people have told me it's far less
* than that, so I'm going to be stupidly cautious
* and knock that down to a nice round 2.
(Note: 2.5 + 2.5 + 1.7 does not equal 5.7, but this does not change the conclusion.)
Besides the lack of previous research, another aspect that made the author curious about the randomness of mouse inputs is that the X and Y positions are necessarily dependent on the previous position. There are only so many pixels you can move to and a few patterns that one is likely to make (circles, zigzags, perhaps figure eights…). It does not seem obvious that this is unpredictable enough for cryptographic purposes.
2.1 Prior Software Implementations
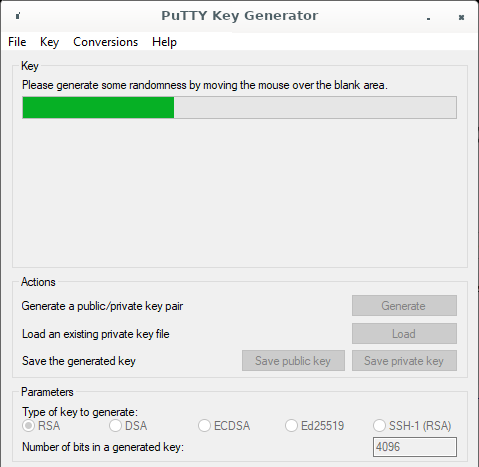
PuTTY is the most widely used software of which the author knows mouse inputs were used as the only source of cryptographic randomness. The source code for version 0.78 suggests that a lower bound is enforced of 256 bits for any key (most realistic keys are larger), for which it then collects 128 samples3. It limits the number of samples collected per second because “Some pointing devices (e.g. gaming mice) can be set to send mouse-movement events at an extremely high sample rate like 1kHz”, which seems like a sensible solution. Subsequent handling of the obtained input, which uses a Fortuna-like algorithm since 2019, was not investigated.
A JavaScript implementation with several million weekly downloads on npm suggests seeding the random engine by listening for a hundred mouse move events, taking the mouse X, Y, and the current time in milliseconds.
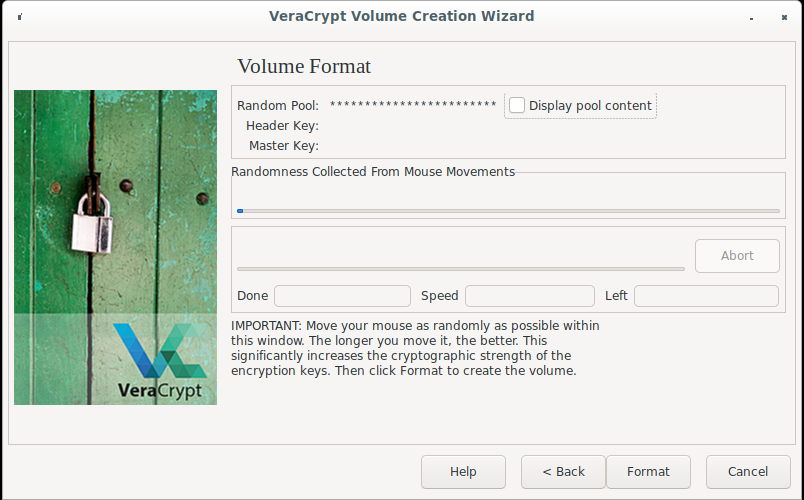
VeraCrypt has two implementations:
one
in C and another
in C++. The latter is duplicated to another file.
Further randomness is also mixed in for the C implementation,
including hard drive statistics, process ID, and available RAM. The C++
implementation uses /dev/(u)random/ and a “JitterEntropy library”, except on
Windows where both additions are skipped.
The C++ implementations include a code comment that refers to a Stack Exchange
post where the author says “It can be assumed (a very conservative estimate) is
that each move event will yield at least one bit of entropy”, with no
explanation or reference (the claimed “typical 15” Hz update rate is
incorrect, but it is not known how large a factor that was in their
calculation). The C implementation calls ProcessEntropyEstimate which
cites
the same Stack Exchange post. For timing information, GetTickCount()
is used, which “is limited to the resolution of the system timer, which is
typically in the range of 10 milliseconds to 16 milliseconds”.
All three implementations appear to be structurally identical to the TrueCrypt imports in commits c606f0866 and 7ffce028d from when TrueCrypt was abandoned in 2014.
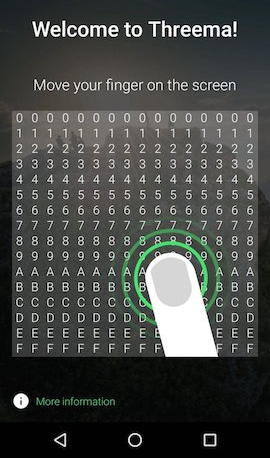
Threema uses 200 touch inputs
on iOS, but this implementation is not an apples to apples comparison with
other software because mice inputs are different from touchscreen inputs. The
separate Android implementation
uses 50 “steps”,
where one step seems to be one touch event. Upon every touch, the position and
time (using new Date().getTime()) are encoded as string and hashed with
SHA-256, then added to the hash from the previous step, if any. This is later
XORed against SecureRandom output.
It appears that all but one of the implementations collect a relatively cautious number of points. Only PuTTY has code comments explaining the rationale and implementing some quality control, limiting too-frequent input events. VeraCrypt checks in its C implementation that the last two events were not equal to the current one before using the data: although this would not prevent too-frequent updates causing movements of only one pixel at a time, it might prevent other failure cases that we are not aware of. The code comment in VeraCrypt’s source is considered less reliable than PuTTY’s because VeraCrypt’s source does not claim to be based on any actual test.
3. Method
Initially, a dataset was created by asking colleagues, friends, and some online volunteers for mouse traces. Mixing novice users with experienced ones could have revealed differences in how they go about this task. However, while analyzing the randomness of these inputs, a better method was discovered:
No matter how closely a user tries to repeat the exact same movement (within or between traces), there are still occasional random deviations. Finding and using these deviations to establish a lower bound of how much randomness they contain is simpler when the traces are similar than when they are very different.
The collection method for both approaches consisted of a webpage where the user is asked to generate a private key in the same manner as in real-world software. After pressing the “Generate secret key” button, mouse inputs within a rectangular region are captured and a progress bar is displayed until 300 points are collected. USB mice do not use interrupts, so precise timing are not commonly available in modern hardware. The browser’s time resolution is milliseconds, similar to the method used in the software PuTTY4. The positional resolution is in pixels. Each trace consists of 300 points, where each point contains the X and Y position as well as the relative time in milliseconds.
The author collected 30 traces in one sitting to maximize how well they replicate the movements made. The mouse was moved left to right, back and forth. Each trace was recorded on the same setup. This set is called the “Repeat dataset”.
The originally collected data from different participants doing realistic traces is still included in the analysis because it provides interesting contrasts. This set is called the “Group dataset” and spans at least twelve different setups.
The count of 30 traces for the Repeat dataset was chosen to make direct comparisons to the Group dataset, which also contains 30 traces.
Particularities of the hardware (which might introduce or suppress random deviations) or of individual persons (which might be more or less consistent) are outside the scope of this research but will be discussed in future work. The hardware used in the two datasets consisted of different computers (desktop or laptop). Most users used mice, but some touchpads are also represented (in this work, mouse should be read as generically meaning a pointer or cursor). Touchscreens were not used.
4. Results
Both datasets are available in anonymized form:
The mouse trail is not visible to participants while the trace is being generated. It has been made visible in recordings for analysis purposes. The following three screenshots each show one trace from the Group dataset.
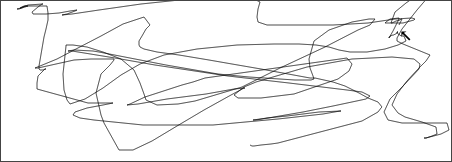
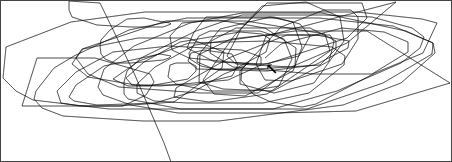
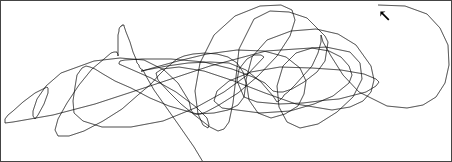
And the following three show traces from the Repeat dataset.
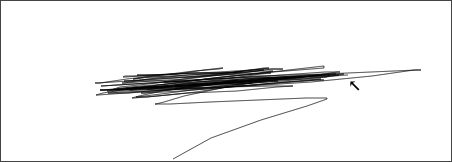
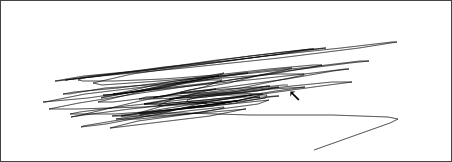
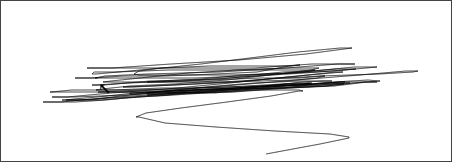
That the Y position varies so much between traces from the Repeat dataset was not something the author realized. Not all Repeat traces do this as much, but they are similar.
Replays can be shown in the collection software by providing trace data in the hash part of the URL, e.g.: https://lucgommans.nl/p/mouse-randomness/#[[30,90,101],[2,0,4],[-2,0,2],…,[4,6,1]]
4.1. Positions
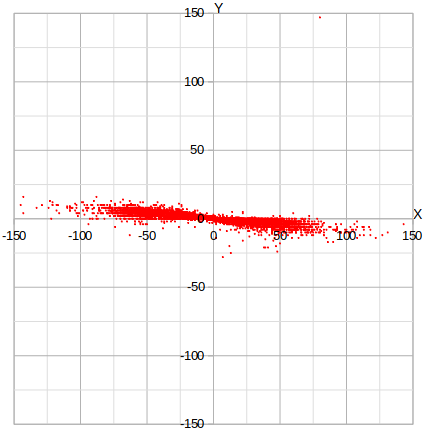
From the Group dataset, the distribution of X and Y positions relative to the previous mouse position is as one might expect from a rectangular region and the way a human wrist moves: slightly more flat than tall, centering on the (0,0) coordinate. Points farther out from the origin are at higher speed. An absolute limit exists in terms of the available space in the input region.
Note that the Y-axis in the following plots is mirrored from the screenshots above. In the capturing software, the origin is at the top left and Y values increase towards the bottom whereas, in these graphs, the Y increases upwards.

The lack of gaps indicates that there is not a discrete set of preferential speeds that people use.
The Repeat dataset below shows strong clustering in the expected sideways directions.
The number of individual points visible in the graphs above shows how much variation there is. To guess the inputs that a person generated while creating a secret key, one has to pick one of the possible points for every position in the trace (in addition to timing information). Most points are unique within a trace, even for the Repeat dataset. The number of unique points per trace is shown in the following graph.
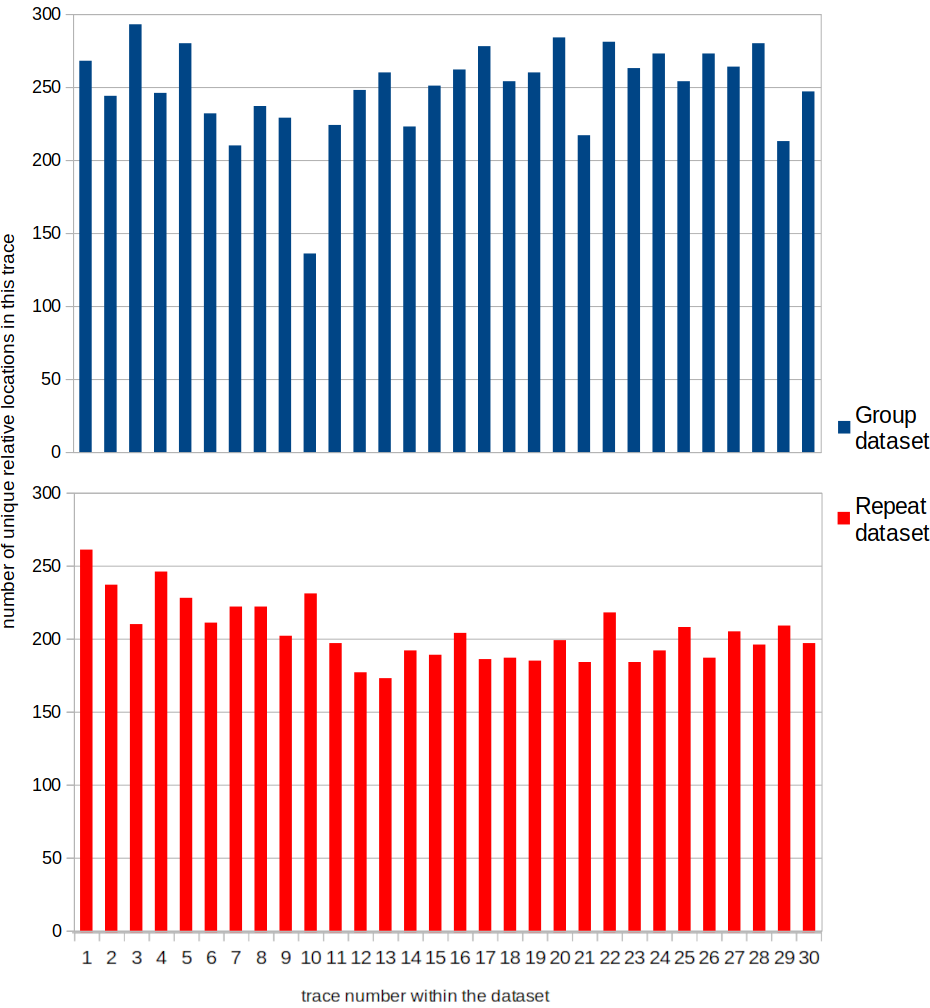
The outlier of 136 in the Group dataset is from a trace from the author themself, where the mouse was moved very slowly.
Consecutive position updates are very rarely identical. Moving one’s mouse in one direction at a constant speed seems not to be a frequent occurrence.
In terms of absolute positions, the traces from both datasets show almost exclusively unique points (up to 21 points, out of 300, are not unique).
From the Repeat traces, each left to right and right to left segment was extracted. These segments are two or more consecutive points where the X position only increases or decreases. Across the 30 traces, 1462 segments were drawn. After removing timing information, leaving only the relative X and Y positions defining a segment, each one remains unique. (This even holds when removing the vertical position information, which makes sense given the shape drawn, but this will be ignored for simplicity.) The number of points before reversing direction varies as shown in the following plot.
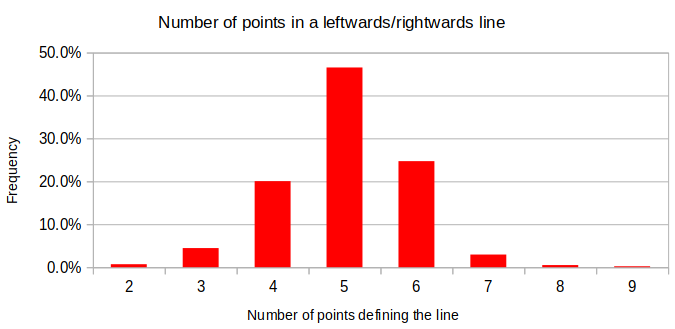
The maximum speed achieved in a segment varies. (The absolute speed is taken, making it positive even when going towards negative X.)
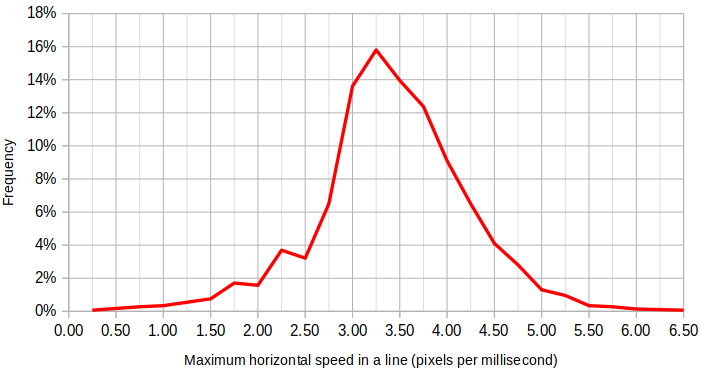
Among the thirty collected Repeat traces, the number of segments identified is between 44 and 53 (inclusive), with two outliers on each end where 40, 43, 60, and 63 segments were drawn. The only number of segments per trace that occurred more than three times was 47, which had seven occurrences.
4.2. Timings
Timings in the Group dataset are more regular than positions: except when leaving the input area, subjects generally provided continuous input and the position update event handler proves to be called on a regular interval. For 18 out of 26 traces, the mode (baseline) of update intervals is 17 milliseconds, for which the distribution of update intervals looks like this:

At 60 Hz, it fits that the time interval is 16 or 17 milliseconds in 59.9% of the cases due to the fractional number of milliseconds. Why other values occur is not known. The minimum time interval is significantly lower than the mode in all setups: perhaps the event dispatcher is catching up, causing a shorter interval between two events. About 80% of the updates fall within 15 and 18 milliseconds (inclusive).
Across the twelve setups, three did not have a mode of 17, but instead of 7, 20, and 33 milliseconds. Aside from the latter being a Chromebook, details of the other two setups are not known. For the Chromebook, it did not matter whether the touchpad, a wired mouse, or a wireless mouse was used, but which screen was connected made a difference.
4.3 Statistical Software
The dataset is not large enough for good statistical analyses to find biases
that indicate predictability. The timing data in particular very strongly
biases towards specific values. Because the position data is more promising,
the tool ENT, by Fourmilab (version
1.2debian-3) was used to analyze that.
The files for the two datasets was formatted such that it contains only numbers
in ASCII encoding (zero through nine and minus; the source file’s array
structure was removed). The maximum entropy this file format could contain is
log(11)/log(2)≈3.46 bits per byte (if the minus was able to
occur in any position).
ENT reports the following results, for the Group and Repeat datasets, respectively:
- Bits of entropy per byte: 3.1 and 3.2
- Chi square test: “less than 0.01% of the time” for both sets
- Arithmetic mean: 49.6156 and 49.9430
- Monte Carlo Pi value: 4.0 for both sets
- Serial correlation: -0.257217 and -0.195773
The source code of the tool documents that the “bits of entropy per byte” value is based on the character distribution.
5. Discussion
5.1. Entropy
Timing seems to be dependent on the hardware, operating system, and other software that requests CPU time. This makes it hard to draw definitive conclusions about what aspects can be relied upon regarding the time interval. Given that most points in all traces had a predictable time interval, the safe thing is to assume that events are always generated with a predictable interval when the mouse is continuously moved. The absolute starting time can be an input, but many key containers (e.g., X.509) have a creation time embedded which narrows this value down.
The position updates have clearer properties. The Group dataset shows that people do not make random movements but rather draw straight lines, waves, circles, eights, etc., often alternating between shapes and moving to focus on different parts of the recording area. But as the Repeat dataset shows, there is still a lot of variation when attempting to make the same shape in the same area over and over.
After indexing consecutive point combinations in 25 of the 30 traces of the Repeat dataset, around 40% of the combinations in subsequent traces were still new. This does not mean that 60% of a trace can be reliably predicted; rather, for 60% of the points, the next point existed in the index at all. Extrapolating from this data, more than ten thousand unique combinations are likely in use for this pattern with varying probabilities, meaning that each point has more than a hundred possible continuations on average. Various continuations have similar probabilities, i.e., more than one or two likely continuations exist for any given point. This indicates that there is more than one bit of uncertainty per point in the Repeat dataset.
Even if an attacker somehow knows what shapes were drawn and where, there are still multiple positions to choose from with similar probabilities for any point in the trace.
Although attacks only ever get better, the amount of variation within and between traces makes it seem unlikely that an attack exists where the precise position for any individual update can be predicted with high confidence. Collecting a few hundred position updates as input for a cryptographic key should therefore put the number of possible keys well out of reach for contemporary hardware to search through (256 bits of entropy are considered safe for the foreseeable future when using quantum-resistant algorithms).
As a second way of calculating the amount of entropy per point, the 1462 unique
segments (as defined above) from the Repeat dataset can be considered. A trace
from the Repeat set, containing 300 points, sampled at about 60 Hz, typically
contains 44 to 53 segments. Because each of these could have been drawn at
least 1462 ways, the entropy should at least be
log(146244)/log(2)≈462.6 bits of entropy (with 300
points per trace, each point contributed 1.54 bits of entropy on average). This
makes the assumption that each segment variant is equally likely: the real
entropy value could be lower if some of these 1462 segments are more likely to
be drawn than others. However, it also ignores that the set of 1462 segments is
not exhaustive. Considering the birthday paradox, duplicate entries will appear
long before getting close to an exhaustive list, yet there were none. If the
latter aspect is the dominant one, entropy is higher than the calculated value.
Lastly, the statistical analysis can be considered. The relatively small amount of data makes this of limited reliability. The estimated entropy is just over 3 bits per byte. With each point (x and y in ASCII) taking 4.2 bytes on average in the files that were analyzed, the resulting 13 bits of entropy per position seems high.
The true lower bound for how much entropy is in each (X,Y) point or in a given trace cannot be determined because it is not known what the theoretically best possible attack would be. Timing uncertainty should also be considered, but does not add much to each point unless the user introduces random pauses.
5.2. Quality control
There is at least one reliable method to reduce the randomness: move the mouse fewer pixels from one position update event to the next. At the slowest measurable input speed, such an event can be triggered only eight ways: increase or decrease the X position, Y position, or both by one pixel. How much entropy remains in each position depends on the confidence with which it can be said which of the directions was chosen.
Programs could reduce the input data quality risk by only sampling the position once it moved multiple of the minimum measurable unit (e.g., on a computer screen: multiple pixels). This threshold does not need to be high and should consider that the distance may not be traveled in a straight line: if the cursor moves along the path (0,0),(1,0),(0,0), it should be considered to have moved 2 pixels rather than 0.
The variance of the direction could be monitored to avoid making the speed the only unknown factor. Other statistical tests may further improve the confidence in the choice of key.
5.2.1 Point Collection Using a Minigame
Not everyone will know what best practices are for entropy generation, nor want to read a text about it. To make key quality more consistent and prevent low quality outliers, a minigame could be used where random squares within the input area light up and the user needs to move into the square as fast as possible, being scored on speed.
Where the squares initially show up does not really matter and can be seeded with the current time: the randomness is in the position deviations, not in the rough locations moved to (though this can add to it). By choosing the next square’s location based on the exact millisecond when the user hit the previous square, these locations will furthermore start to depend on minute details of the user’s performance rather than being deterministic.
Using a game could also help in making movement timing more random because the user might stop moving soon after hitting a square and the next square does not show up for a second.
Sharing one’s score (e.g., how many squares one hit), as users might intuitively do, would not significantly aid cracking the key because it contains too little information.
Of course, users must be informed that their performance matters and this is not here as a speed bump in their workday, e.g.: “the game is designed to maximize encryption key quality and takes about ten seconds, click here for more info”. As an estimate before factoring in quality control, 8.6 seconds of continuous playing generates >256 input events when sampling the pointer at 30 Hz (most systems allow ≥50 Hz, and most input events are expected to be usable when moving at an appropriate speed for a game). Without any game, users need to spend just as much time moving the mouse, it would just be undirected.
6. Future Work
In line with Kerckhoffs’s principle, we would suggest assuming that an attacker can find out what hardware and software combination a given person is using. This affects the randomness of individual points’ positions as well as their timings, resulting in keys of a different quality if the same number of points is gathered or the same amount of time is used for collection.
This work intended to establish an estimate of the randomness but could not explore all these aspects:
- The software’s capture method
- …of timing input, such as
new Date()vs.GetMessageTime() - …of position input, such as capture areas of different sizes
- …of timing input, such as
- Software used on the system (operating system and perhaps also the desktop
environment; anything that attempts to deny fingerprinting users by mouse
movements; remote desktop; etc.)
- Software settings, such as the mouse sensitivity setting and display scaling
- The kind of input device used: mouse, touchpad, touchscreen, VR remote, accessibility devices, etc.
- The properties of the input device used, such as mice with DPI settings
- The connection method: PS/2, USB, Bluetooth, proprietary wireless, etc.
- Persons with accessibility needs: those who cannot see the pointer (or not well, or with a different processing delay such as from visual prostheses), muscle or nerve issues that affect how the mouse is used, etc.
Environmental aspects that were seen in this study include Windows, Debian, Ubuntu, Wayland, X.org, and a Chromebook. One user with a unique timing baseline used a KVM switch, but connecting the mouse directly made no difference and the cause could not be identified. On the Chromebook, disconnecting the external 4k TV screen (via HDMI) brought the timing baseline down from 33 to 17 milliseconds. Perhaps the update rate of the display was 30 instead of the typical 60 Hz and the mouse or touchpad event rate is kept in sync with that.
For blind users, auditory cues might provide enough feedback to move a mouse inside the capture area to allow them to perform this task, but the quality of this data should be verified. Letting another person complete this task is disadvantageous because it reduces their independence, but could be a viable temporary workaround because memorizing the pattern one drew does not seem to allow the third party to find (crack) the derived secret key.
It would also be useful to know the rationale behind filtering duplicate events in VeraCrypt’s (or, originally, TrueCrypt’s) C implementation. Are there setups that generate duplicate events consecutively, perhaps as a failure case? It sounds plausible, even if there currently isn’t a known setup that does this. Should all implementations add protection against this, just in case?
Finally, an interesting attack could be recovering the timings and position information from a shoulder-surfed recording. Consumer-grade cameras can commonly record at speeds faster than a computer monitor’s refresh rate, leaving only the small amount of random internal variation in the timing component. When a generated key depends mostly on this entropy source, it may be appropriate to warn users about who can see their screen.
7. Conclusion
Mouse movement events were found to have enough random variation to be usable as the only source of randomness for generating a secure cryptographic key.
An analysis of how many different sequences were seen when the user was trying to be predictable, suggests that a lower bound of entropy per (X,Y) location is more than one bit. This assumes a 60 Hz sampling rate and that the mouse is being moved at typical speeds as seen in this study. However, quality issues may still be introduced due to user behavior or hardware variations.
Software that relies upon the randomness of mouse inputs is recommended to wait for a minimum travel distance between sampling and implement further checks to prevent some user-induced failure modes and increase confidence in the key material. Users should be shown a warning and asked whether they want to try again if the checks do not pass.
The timing of input events is less variable than the position changes. The vast majority of points collected in this study centered around a 16.7 milliseconds time interval. Timing is still believed to be useful as an auxiliary input to a CSPRNG, but no estimate was made about the entropy this provides. Depending on the root cause for the variation in timings, one might be better off using that directly. For example, if the variation is due to process scheduling, then this could be collected directly5 rather than measuring this indirectly as part of mouse events.
Six implementations were reviewed from four projects (PuTTY, David Bau’s
seedrandom, VeraCrypt, and Threema). PuTTY backs up their implementation with
code comments that demonstrate the number of collected samples is more than an
arbitrary choice and implements rate limiting to prevent low quality input
events. VeraCrypt cites a source for the strength per input estimate, but the
source does not give any rationale for their estimate. Threema and seedrandom
do not provide any rationale for the chosen implementation. The lowest number
of input points used is Threema on Android with 50, although this is a
touchscreen implementation that this work did not investigate. All others
collect 128 or more points.
As future work, different hardware, software, and persons’ behavior could be studied to try to uncover more failure cases where the position or timing randomness deviates from the observations above.
8. Sources and footnotes
8.1. Image sources
- Screenshot of
puttygenfork (GPL), taken from hpcleuven on GitHub, modified title bar to match original PuTTY window - Screenshot of Threema finger input dialog (CC BY-NC-SA 4.0) from SecureChatGuide.org
- Unsourced images are own work
8.2. Footnotes
-
PuTTY, VeraCrypt, and Threema respectively generate server access, disk encryption, and communication keys which do not expire. Each uses a mouse movement event handler to collect both the mouse position and the time. ↩
-
Cryptography Engineering, by Ferguson and Schneier, section 9.5.1 Entropy Sources ↩
-
The number of bits in the key is used as
raw_entropy_required, butentropy_gotis increased by 2 for everyWM_MOUSEMOVEevent. ↩ -
GetMessageTime()is used to obtain the time, which returns milliseconds ↩ -
Documentation and Analysis of the Linux Random Number Generator, by atsec security GmbH via the BSI, section 3.5.2.8 Scheduler-based Entropy Collection ↩