NEWS
Using power side channel for fuzzing coverage
X41 performs a lot of fuzz testing for clients and internal research purposes. A few years back, Markus, Eric and q3k were discussing the use of power side channel analysis for fuzz testing. Since then, two papers discussing the topic were published. One assumes the firmware to be available when testing, the other doesn’t seem to be available to the public. Since we were still curious, we started to investigate the topic.
For the use case that was interesting to us, we had several assumptions:
- Source code or binary is not available
- We cannot attach a debugger
- We cannot run other code on the device
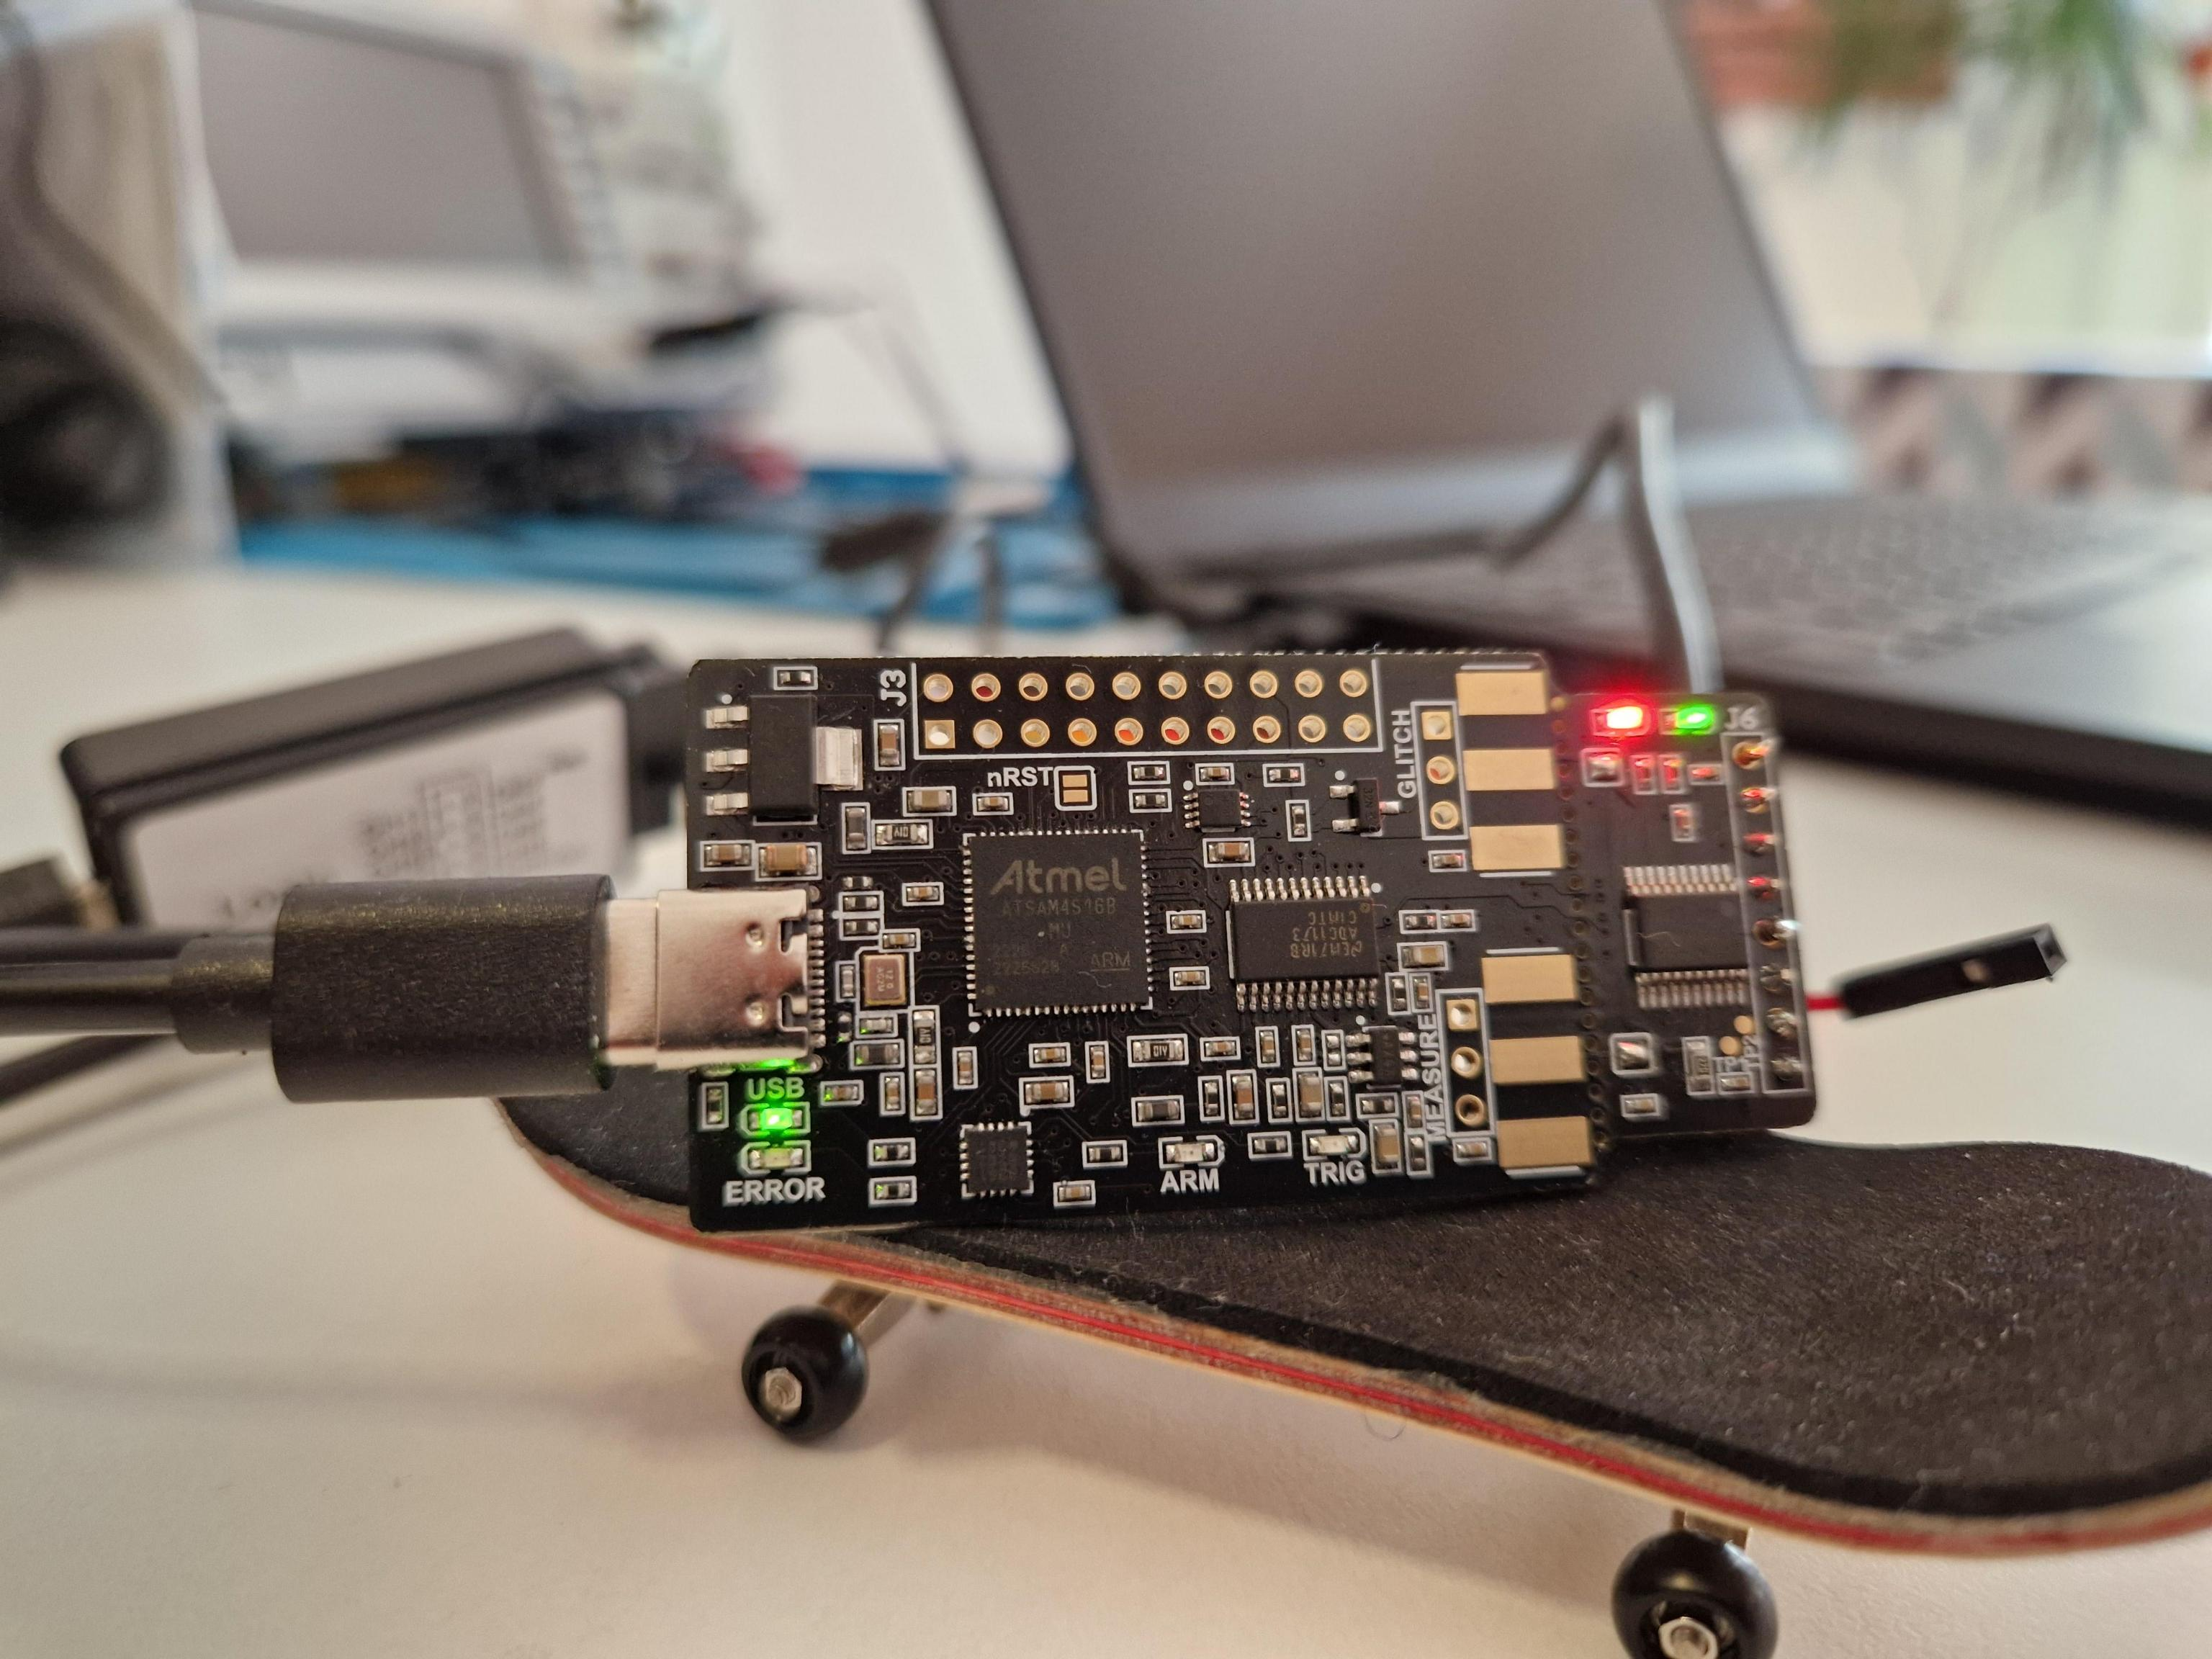
In any of these cases we would consider lifting the code to another platform and fuzzing it there or using the debugger for proper code coverage to be the more useful approach. The ChipWhisperer-Nano is a good candidate for this research, since there is a Python framework and documentation available that allowed us to get into testing quickly.

Usually, fuzzers like AFL++ or Jackalope use code coverage as a metric to guide the fuzzer towards interesting inputs. If a newly generated input causes coverage of a line of code or instruction that was not reached before, it is considered interesting and will be added to the input corpus for further mutations. This allows the fuzzer to progress deeper into the call chain of the target and reach interesting code paths. This guided approach works faster than plain brute force, but the speed of the fuzzer and the harness is still important go reach a useful coverage level of the target.
How can we replicate this guidance using power traces? The ChipWhisperer-Nano has two sections: target and capture. As target, a STM32F030F4P6 is executing the code that we are interested in fuzz testing. The firmware we are interested in fuzzing can be uploaded using program_target(). The capture part allows us to interact with the target and inspect the power it draws for various operations.
Sending some input to the target and retrieving a power trace is only a few lines on Python:
scope.arm()
target.write(data)
scope.capture()
trace = scope.get_last_trace()
A captured trace is an array of numpy.float64 data points that represent the amount of power used at a given time which we can analyze after the test was performed.

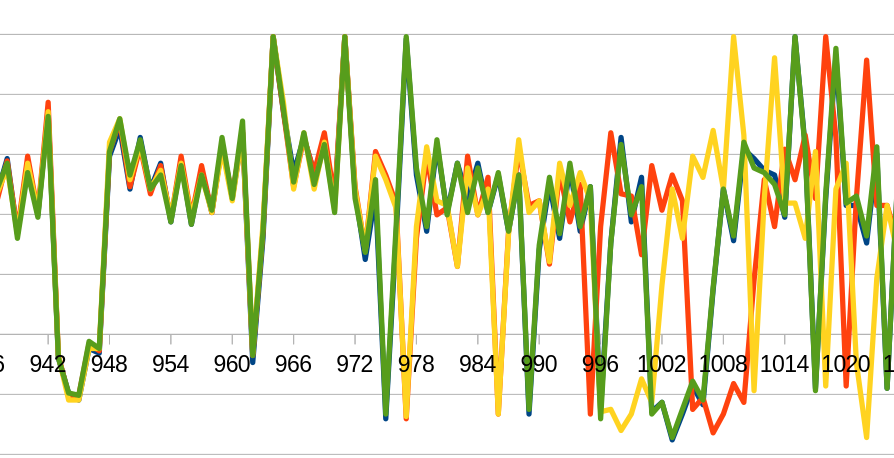
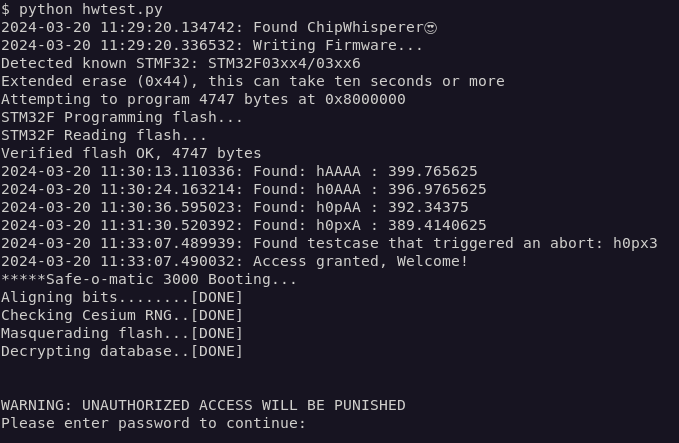
One of the learning examples for the ChipWhisperer uses this data to compare the power drawn during a password check. The idea is that for a simple, strcmp()-based password check, if the first letter of an entered password is valid, the power trace will look different from all the other traces where the first letter is incorrect. This is due to the fact that strcmp() aborts when the comparison of a character is false but will continue to the next character if it is true.
Since there are natural fluctuations (power consumption might vary due to other components, temperature changes…) in the data captured, caused by temperature of minor timing issues, one cannot compare two traces directly. Instead, an algorithm popular in image processing is used, the sum of absolute differences.
sum = 0
for i in range(0, len(trace1)):
    rsum += abs(trace1[i] - trace2[i])
If the sum of absolute differences passes a certain threshold, it is assumed that the traces are not equal, but different from each other. This allows us to differentiate on whether we hit a new code path during our test. To start exploring the options of our approach, we developed a Python-based fuzzer that allows us to start fuzz testing the password example to investigate whether the approach in general seems useful. We needed some code to manage the traces and keep those that the testing deemed useful. To allow us to investigate the data produced, we implemented some functions to dump the traces and input data and re-read them to continue with a given state. Mangling test cases was implemented in a simple way where we replaced bytes at random. Additionally, we needed some code to detect whether we could stop fuzzing, which in this case is simple since we can detect whether we successfully logged in. Being aware that attacks adjusted to the target in question will be faster than this naïve approach, we ran our first tests.

This lead us to the following observations:
Testing Speed
Resetting and re-initializing the target to make sure the traces are accurate requires time and reduces the fuzzing speed a lot.
We decided to ignore fuzzing speed for now. In theory, one would be able to parallelize the approach by testing multiple devices at the same time to increase the speed by scaling proportionally.
Depth Perception
We only know whether the code was traversed in a different way, not whether we hit a new instruction, so we do not get a depth-perception. We discussed whether it is possible to identify code parts by using machine learning or other statistical approaches on the power traces, but disregarded this since it seemed to be unreliable without knowing the code in question.
Learning Example
The password check is a toy example for learning, partially created to work well with power trace analysis. This might make things easier for us. Therefore, we moved on to a more complex target to see how well this might hold up in the real world. The choice fell on qs_parse, because it’s a simple parser, which looked good to handle in the next iteration to test our approach. qs_parse() parses HTTP query strings as they would appear in HTTP GET requests.
We modified the firmware to call qs_parse() on the input provided via the serial interface. To allow us to quickly explore various options, command line handling was added to the fuzzing framework as well as the option to control the input length and to mutate via Radamsa. Since the previous testing uncovered some inconsistencies, a test case is re-played before being added to the corpus to make sure it’s stable and avoid false positives. After adjusting the threshold at which test cases are considered interesting, the fuzzer started generating test cases that look certainly useful when testing a query string parser.
b'AAAAAAAA?AAAAAA' : 233.8046875/23.0
b'AAAAAAAA?&AAAAA' : 253.6640625/18.828125
b'AA=AAAAAAAAAAAA' : 263.87890625/21.01171875
b'AAA&AAAAAAAAAAA' : 226.7265625/22.83984375
b'AA=AAAAAA?AAAAA' : 242.27734375/20.68359375
b'AAAAAAAA?AAAAA=' : 265.09765625/18.6796875
b'AA=AAAAAAAAAAA?' : 231.8125/21.71484375
b'?AAAAAAA?&AAAAA' : 256.4609375/19.65234375
...
These first results look promising to get a useful corpus, but there are still some roadblocks left. Without sanitizers available, manual inspection of all test cases might still be required to identify security issues. For some devices, it might be possible to detect a reboot by monitoring I/O pins, but other security effects might be harder to identify. It is possible to detect loops by identifying reoccurring patterns via the sum of absolute differences. But when we mess around with the input size, comparing traces gets much more complicated: As soon as one input, for e.g., strchr() is longer than another, everything that happens afterwards is shifted and will increase the difference. In future work, one could remove such loops or reoccurring patterns in the traces to better compare them afterwards.
To confirm the observations we made with qs_parse, we tested the code on libyuarel and achieved similar results. Nevertheless, the generated patterns looked interesting, so we added a command line option to allow crude synchronizing with AFL++ to share the generated corpus files between AFL++ instances running on the host and our fuzzing running on the ChipWhisperer-Nano.
If you want to do further tests on this, the source code was released on GitHub.